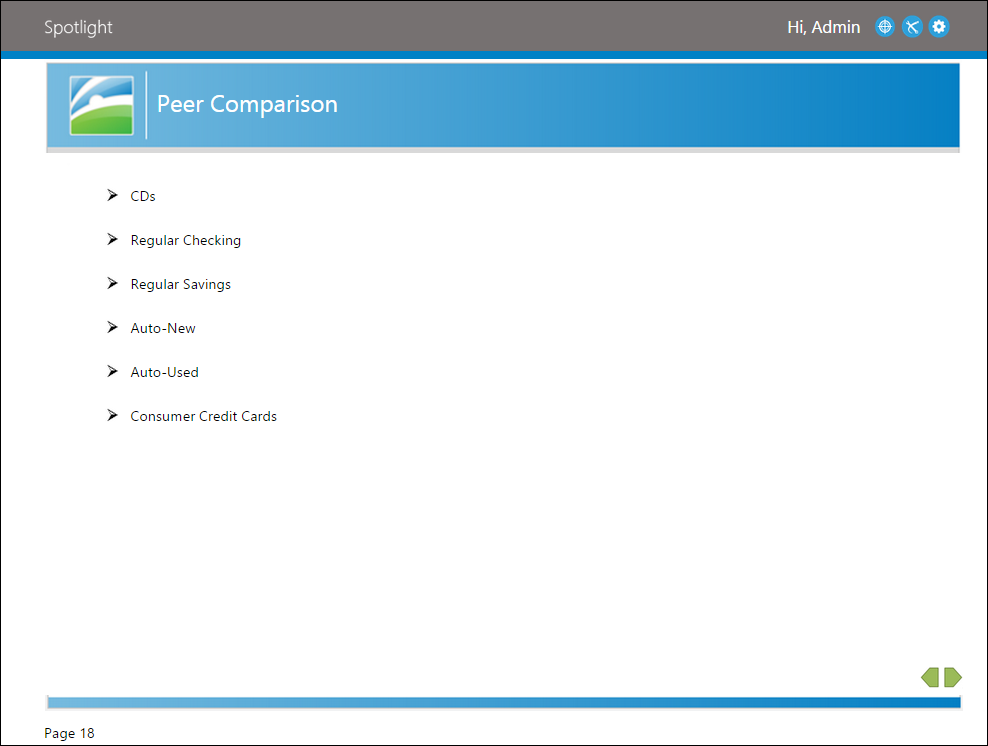
The Peer Comparison page displays the names of the products selected for the Profitability Analysis Presentation. Depending on how many products were selected on the Profitability Analysis Presentation selection screen, the number of products displayed in this page may vary.
Peer Comparison: Deposit Example
The Peer Comparison Deposit Example displays a per account profit and loss comparison for the top performing deposit product selected on the Profitability Analysis Presentation selection screen against the comparable product of the institution's peers.
 |
The product for which this report renders is identified beneath the report title. In the example below, the peer comparison rendered for CDs. |
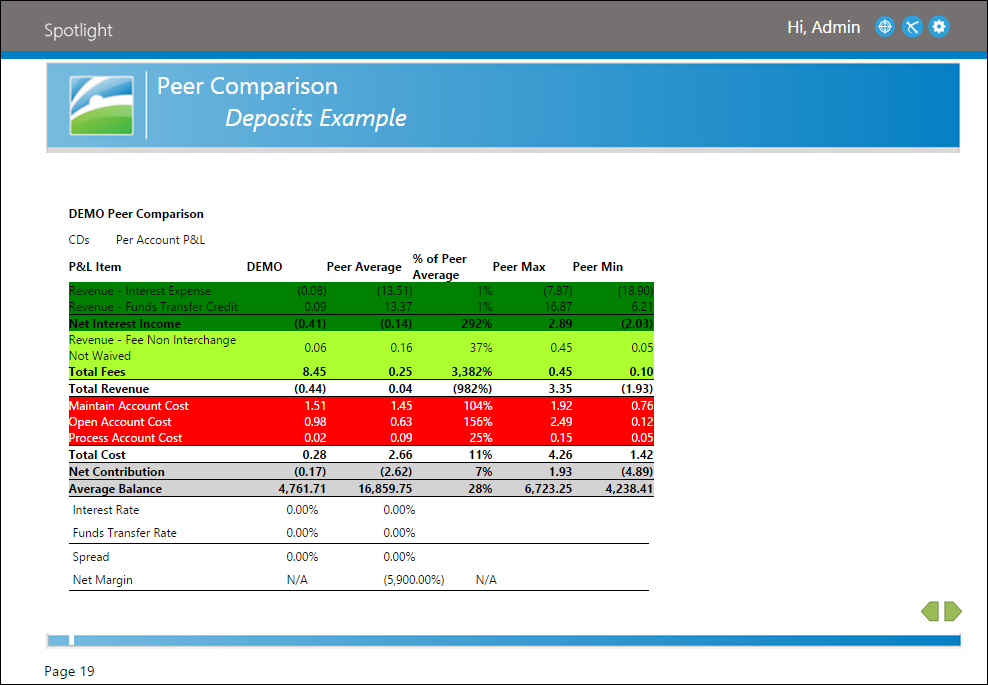
Within the peer comparison the following comparative data displays:
| Column | Description |
| Institution Name | Displays the name of the financial institution. |
| Peer Average | Indicates the average performance of the peer comparison group. |
| % of Peer Average | Indicates the rate of comparison between an institution and the peer comparison group's average. |
| Peer Max | Indicates the highest performance of an institution within the peer comparison group. |
| Peer Min | Indicates the lowest performance of an institution within the peer comparison group |
|
Negative values are indicated in parenthesis. |
 |
The line items within the peer comparison are highlighted according profit and loss.
|
Peer Comparison: Loan Example
The Peer Comparison Loan Example displays a per account profit and loss comparison for the top performing loan product selected on the Profitability Analysis Presentation selection screen against the comparable product of the institution's peers.
|
The product for which this report renders is identified beneath the report title. In the example below, the peer comparison rendered for Auto-New. |
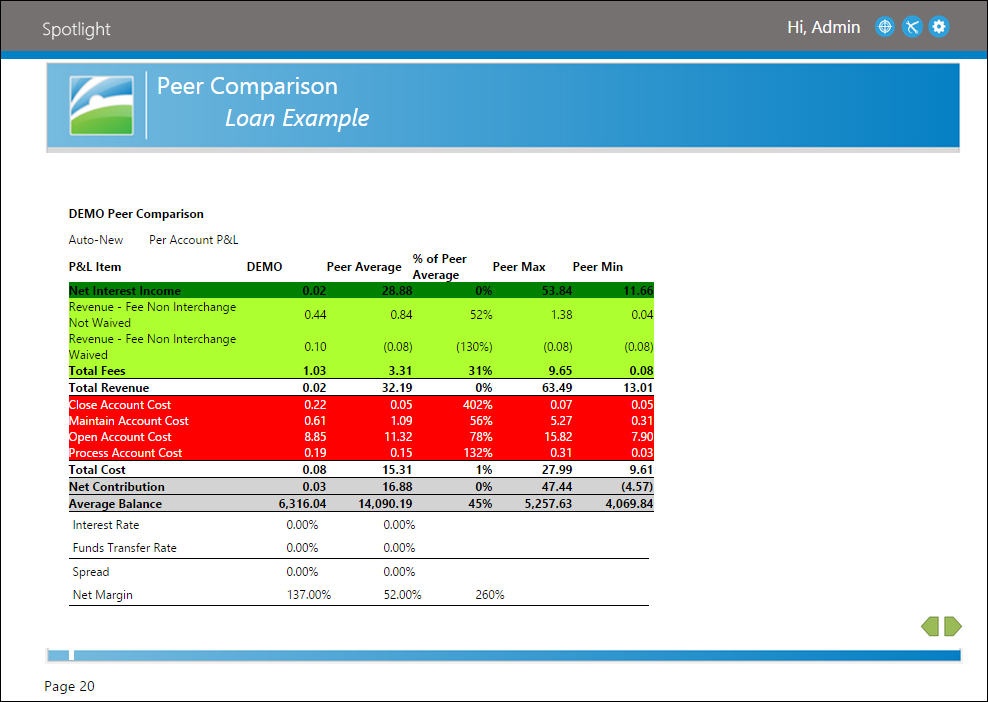
Within the peer comparison the following comparative data displays:
| Column | Description |
| Institution Name | Displays the name of the financial institution. |
| Peer Average | Indicates the average performance of the peer comparison group. |
| % of Peer Average | Indicates the rate of comparison between an institution and the peer comparison group's average. |
| Peer Max | Indicates the highest performance of an institution within the peer comparison group. |
| Peer Min | Indicates the lowest performance of an institution within the peer comparison group |
|
Negative values are indicated in parenthesis. |
|
The line items within the peer comparison are highlighted according profit and loss.
|